How do you debug a program running on an embedded Linux device when the development machine and the target use completely different processors?
This was the problem I wanted to explore with gdbserver. My development machine was an x86 Linux host, while the embedded target used a MIPS processor. I could build the program on the host, but I needed to examine its execution on the actual target. I also wanted to debug code inside a shared object, not just inside main().
The useful combination was a cross-compiler, debug symbols, a target-side gdbserver, and a matching host-side GDB. Here is the experiment and what I learned from the shared-library warnings.
Archive note: First published on Tune2Wizard on 12 October 2013. Reformatted and technically annotated for this archive. Example addresses and local paths have been sanitised; the historical commands and debugging observations are retained in substance. Toolchain names and behaviour depend on the target environment.
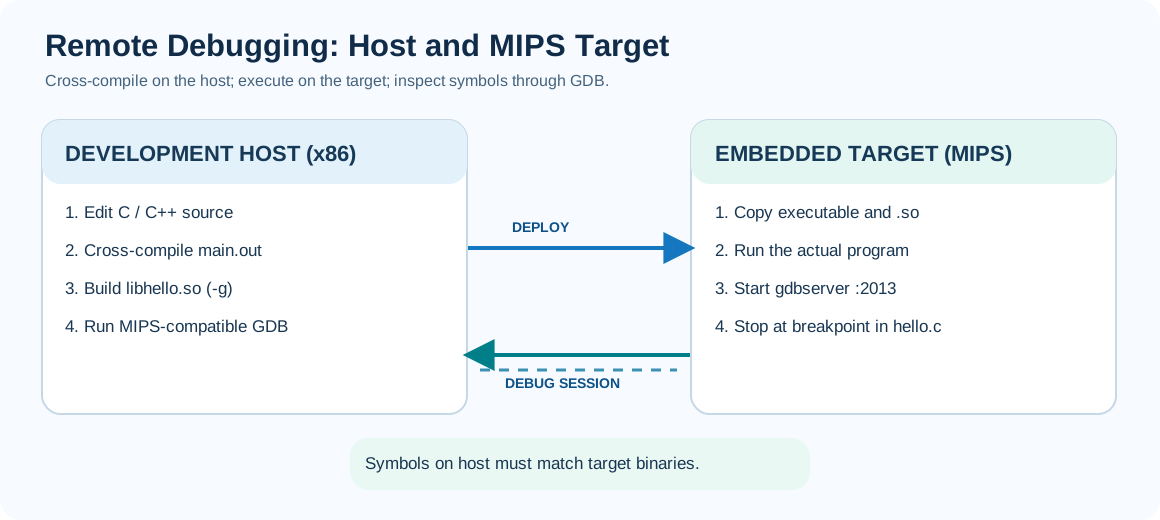
First, understand the two machines
| Component | What it does in this experiment |
|---|---|
| Development host | Edits source files and builds MIPS-compatible binaries |
| Cross-compiler | Produces target-machine code rather than native x86 code |
| Target | Runs the compiled program and gdbserver |
gdbserver |
Exposes a remote debugging session over a TCP connection |
| Host GDB | Reads symbols and lets me set breakpoints, step through code, and inspect execution |
| Shared library | Holds hello_me(), which is called by the main C++ program |
The key distinction is that GDB runs on the host, but the program executes on the target. A regular native host GDB may not understand the target architecture. I need a GDB build that supports the target CPU and ABI.
The original test program
I started with a small C++ program that creates and deletes a derived object, then calls a function from another file. That external function is built into libhello.so.
main.cpp (cleaned-up version of the original demonstration):
#include <iostream>

extern "C" int hello_me();

class Base {
public:
    virtual ~Base() { std::cout << "~Base called\n"; }
};

class Derived : public Base {
    int* values;
public:
    explicit Derived(int n) : values(new int[n]{}) {}
    ~Derived() override {
        std::cout << "~Derived called\n";
        delete[] values;
    }
};

int main() {
    std::cout << "Hello world!\n";
    Base* instance = new Derived(5);
    delete instance;
    hello_me();                 // Implemented in libhello.so
    return 0;
}
The separate C source is deliberately simple:
/* hello.c */
#include <stdio.h>

int hello_me(void) {
    printf("Shreyas... HELLO ME\n");
    return 0;
}
The return 0 is an editorial correction: the historical PDF declared hello_me() as returning int but did not return a value. That should not be carried into a new compilable demonstration.
Cross-compile the shared library and executable
In my historical setup I used a MIPS little-endian cross-compiler, and I built the shared library separately before linking it into the C++ application.
Here is the equivalent command sequence, with the historical local absolute paths removed:
# Substitute the actual prefix from your installed MIPS toolchain.
export CROSS=mipsel-linux-

${CROSS}gcc -g -fPIC -c hello.c -o hello.o
${CROSS}gcc -shared -o libhello.so hello.o

${CROSS}g++ -g -Wall main.cpp -L. -lhello \
  -Wl,-rpath,'$ORIGIN' -o main.out

file main.out libhello.so
-g preserves useful debugging symbols. -fPIC generates position-independent code for the shared object. The final link refers to libhello.so; both the executable and the library must be built for the same target architecture and compatible ABI. The exact toolchain prefix in a real lab might differ.
My original article used a Makefile with cross-compiler, include-directory, library-directory, compiler and linker variables. That was preferable to typing the same long paths repeatedly.
Start gdbserver on the target
Copy main.out and libhello.so onto the embedded target. In a lab where both files are together, one option is:
# On the MIPS target, in the directory containing both files:
export LD_LIBRARY_PATH="$PWD${LD_LIBRARY_PATH:+:$LD_LIBRARY_PATH}"
gdbserver :2013 ./main.out
The 2013 log showed the program being created and the debugger waiting on port 2013:
Process main.out created
Listening on port 2013
In the historical article I used ifconfig to confirm the target’s Ethernet address. For this public example, I will use 192.0.2.50, a documentation-only address. It is not the actual address of the historical device.
gdbserver does not encrypt its debugging protocol; use an isolated lab network or a protected tunnel, not an exposed internet port.
Connect from the development host
# Run a GDB that supports the target MIPS ABI.
mips-linux-uclibc-gdb ./main.out
Inside GDB:
(gdb) target remote 192.0.2.50:2013
(gdb) break main
(gdb) continue
(gdb) next
(gdb) info sharedlibrary
At this stage the original debugging session reached main() successfully. However, GDB also warned that it could not find some shared-library symbols and reported that the dynamic linker or library versions did not match what it expected.
That leads to the most interesting part of this experiment.
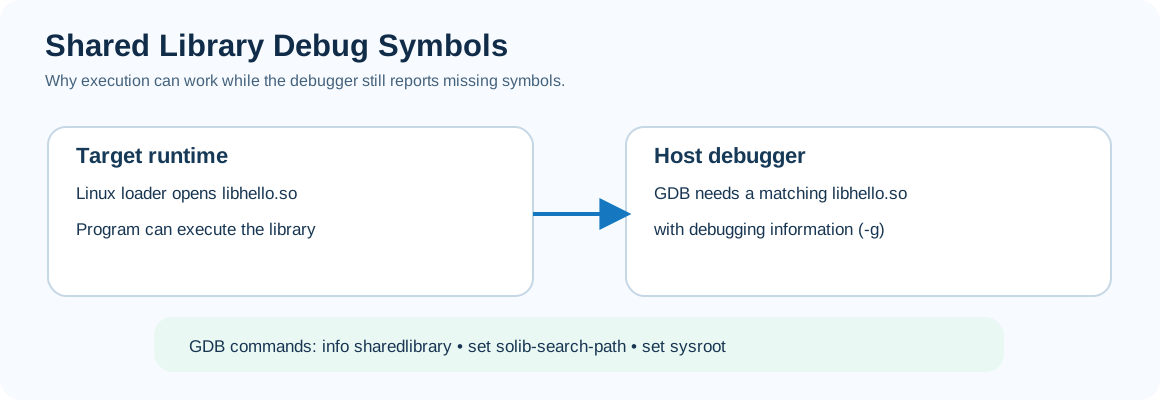
When a library is loaded, why can GDB still miss its symbols?
The target can execute a shared library without the host debugger being able to find its corresponding symbol file. The runtime loader and the host-side debugger perform different jobs.
In my log, info sharedlibrary listed /lib/libhello.so without symbols. I then pointed GDB at the host directory containing my cross-compiled shared object:
(gdb) set solib-search-path /path/to/host/so-cross-compile
(gdb) info sharedlibrary
After that, GDB reported that it had loaded symbols for libhello.so. I could place a breakpoint at the function in hello.c and continue through the call.
A complementary modern technique is to set a matching target root filesystem for system libraries:
(gdb) set sysroot /path/to/mips-target-sysroot
(gdb) sharedlibrary
(gdb) info sharedlibrary
The set sysroot example is an explanatory addition, not a command shown in the archived transcript. It is useful when GDB finds the application library but still cannot match the target’s C library or dynamic linker.
What I would check when remote debugging fails
| Symptom | First thing to check |
|---|---|
| Cannot connect to target | Target IP, TCP port, reachability, firewall and gdbserver status |
Exec format error |
Wrong CPU architecture or binary format |
Loader cannot find libhello.so |
Library deployment, runtime search path and target ABI |
| Breakpoint does not resolve | Was the source compiled with -g? Is the correct library loaded? |
| GDB says library symbols are missing | info sharedlibrary, set solib-search-path, matching sysroot |
| Different library versions or architecture warnings | Verify host symbol files exactly match the files installed on the target |
The practical takeaway
For me, the important lesson was not just the remote connection. It was understanding the separation between the code executing on an embedded device and the debug information available to the developer’s machine.
The target needs to run the application. The host needs the correct executable, toolchain-compatible GDB and symbol files. Once those are aligned, stepping from a C++ program into a shared C library becomes far less mysterious.
Remote debugging becomes manageable when the target executes the code and the host has the matching information to explain what the code is doing.
Shreyas Joshi — originally published on Tune2Wizard, 12 October 2013. Source: personal archived PDF, Embedded-Linux-Remote-Debugging.pdf. This article preserves the original experiment while separating later editorial corrections and lab-safe replacements from the historical transcript.